
GIS Dashboards and Maps for Better Decision-Making in Transportation
/CLIENT: Florida Department of Transportation District 3 Regional Transportation Management Center (Northwest Florida SunGuide Center)
LOCATION: Chipley, Florida
“We are creating innovative solutions that empower our clients to analyze, visualize, and solve problems for Traffic Operations projects.”
CHALLENGE
Gannett Fleming Management Services supports the Florida Department of Transportation (FDOT) District 3 Regional Transportation Management Center (RTMC) as the operations contractor. While conducting this work, the team realized there was a better way for our client to see and manage the data to make better decisions and keep the roads safer and traffic flowing.
SOLUTION
As the geospatial division of Gannett Fleming, GeoDecisions was tasked to provide better visualization of information with dashboards and story maps leveraging RTMC Esri ArcGIS Online licensing for maps and feature services.
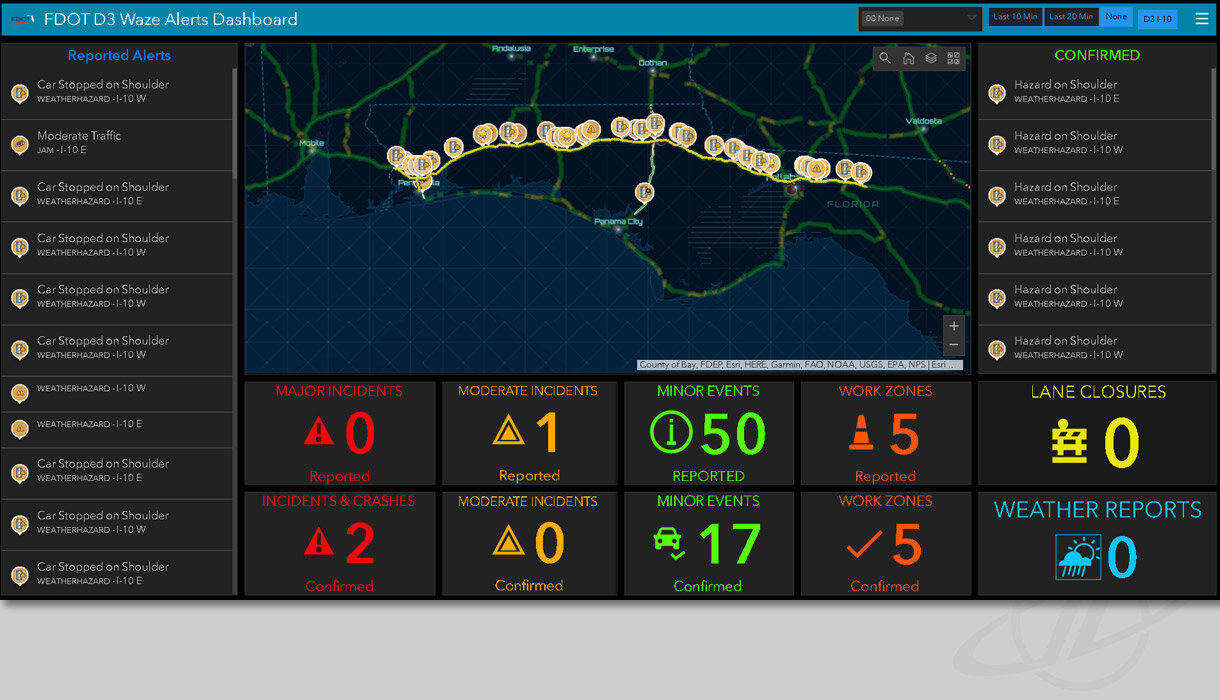
The Waze Alert Dashboard allows operators to receive, sort, and prioritize large amounts of data sourced from crowd-based platforms such as Waze, NOAA, and FL511. The center currently receives about 120 reports an hour from this dashboard. Displays can be customized for use on desktops, mobile devices, or videowalls.
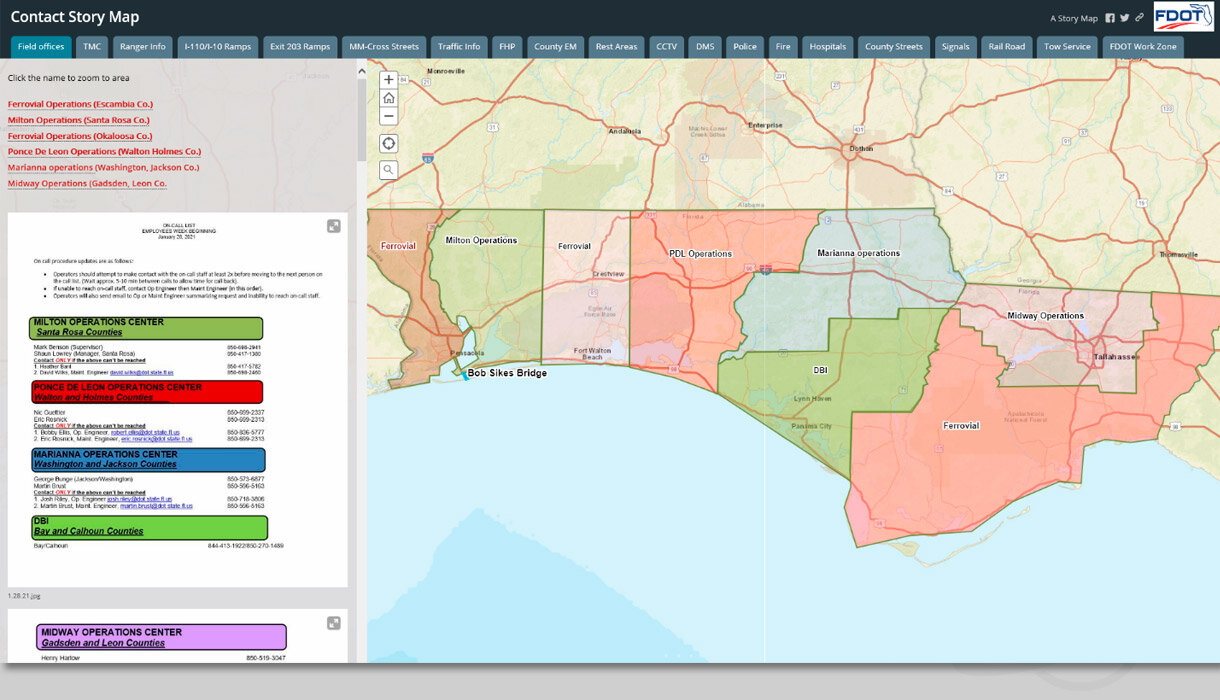
The Contact Story Map is a one-stop contact list for the district. The story map contains contact and deployment area information for hundreds of internal and external partners. Operators need only point and click to obtain accurate contact information.
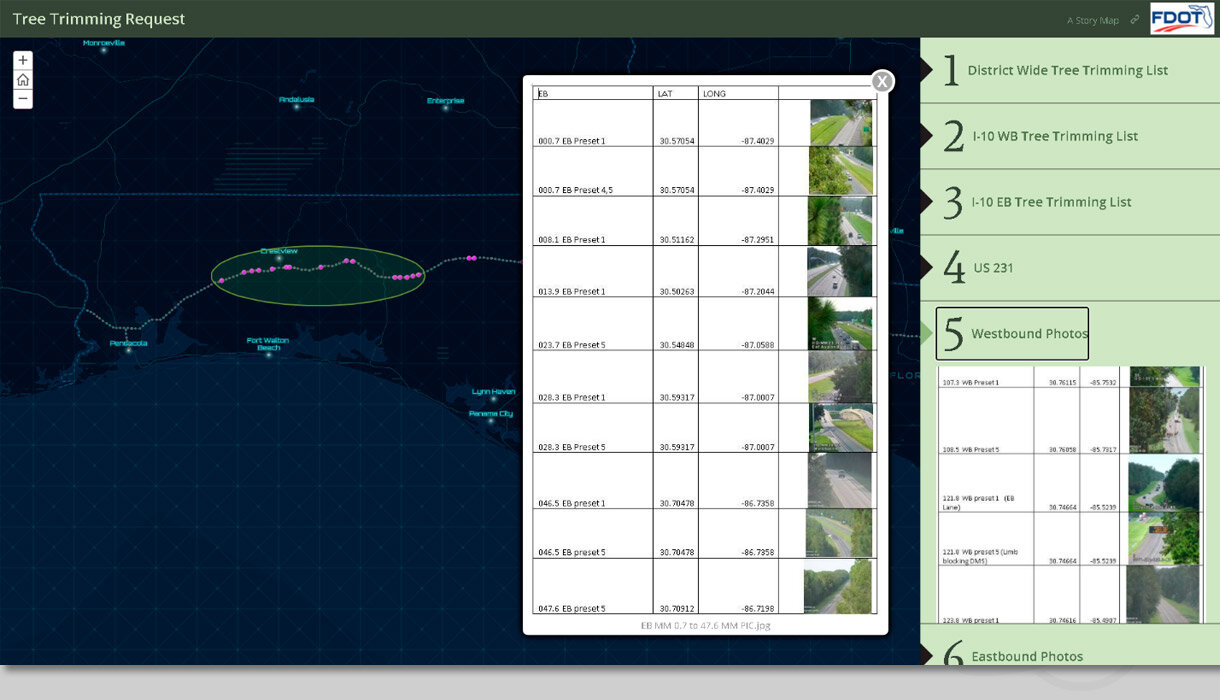
A Tree Trimming Request Story Map shows the locations of trees needing a trim that are obstructing camera views of the roadway, permitting the district to identify the most problematic areas. The application also allows snapshots of each location, giving the user the ability to assess the needs' severity.
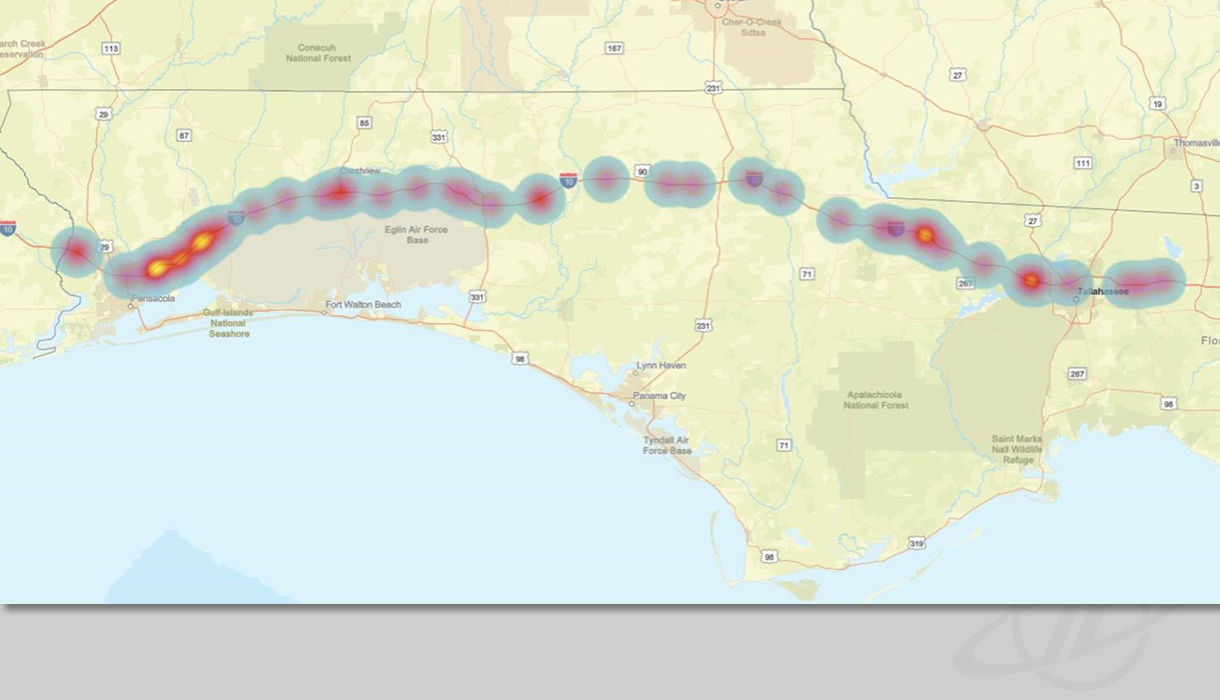
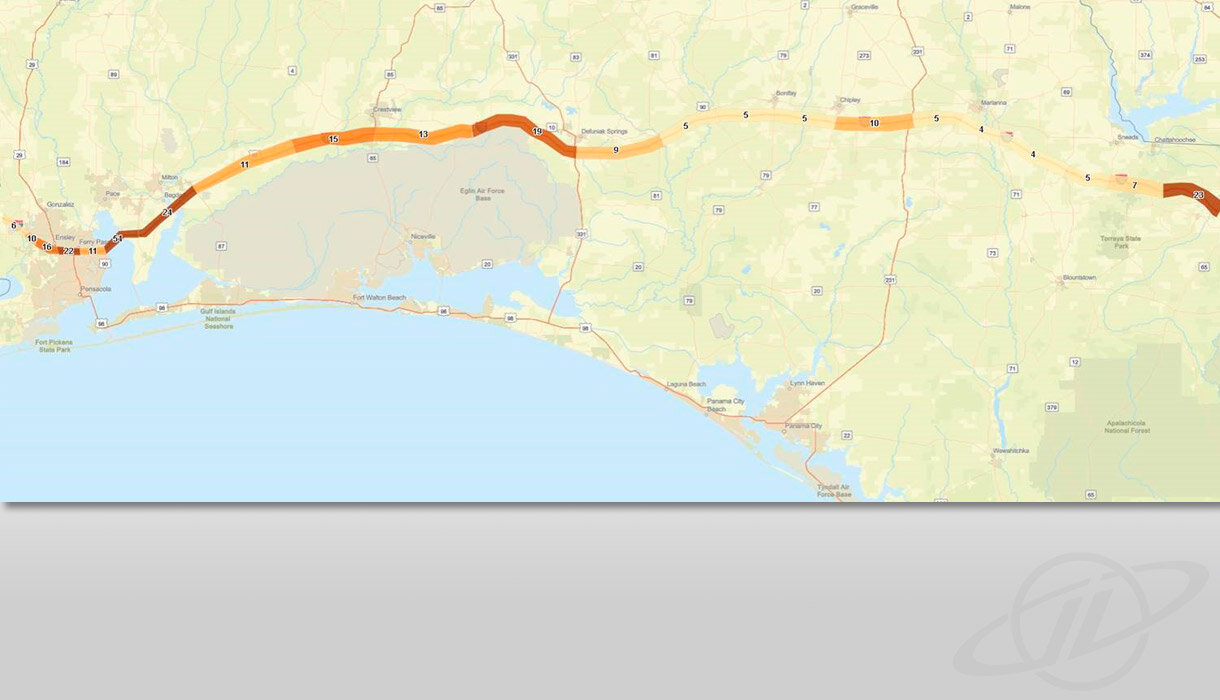
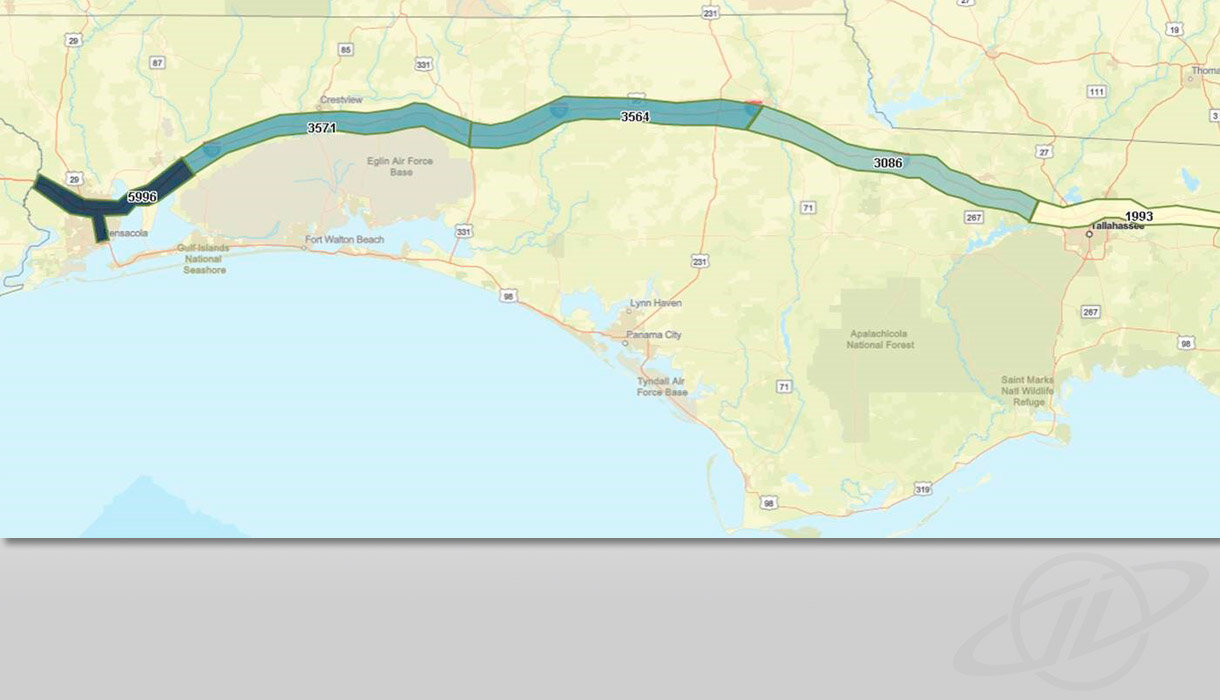
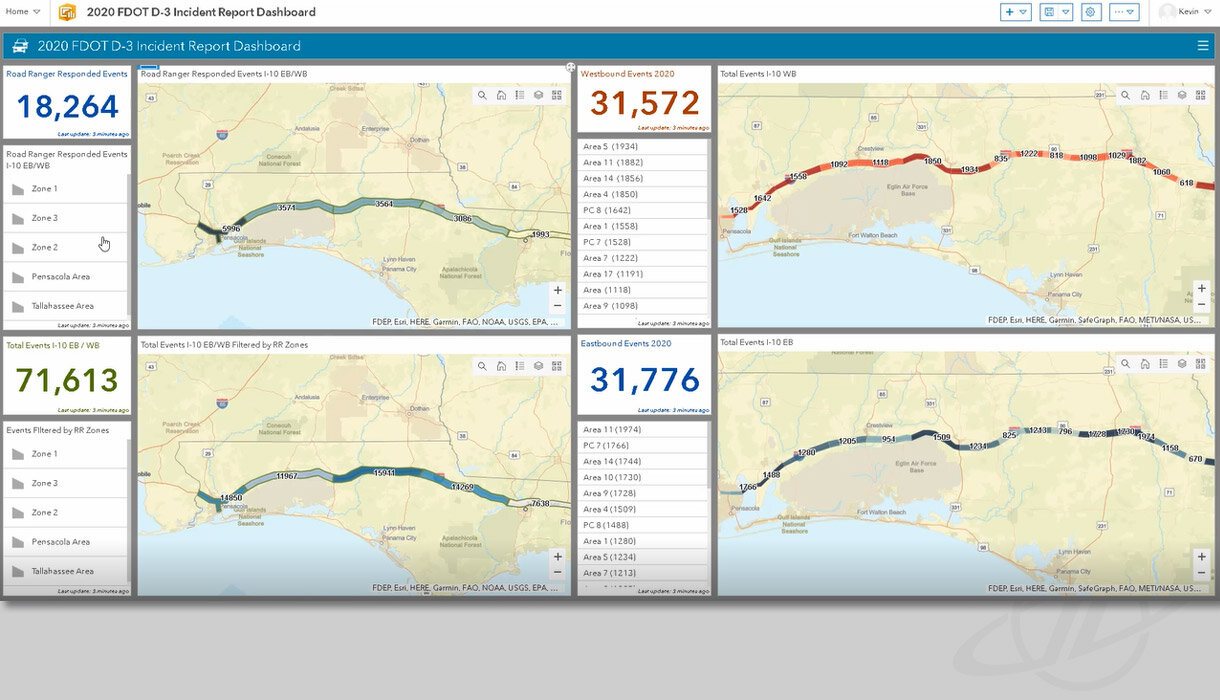
Using geospatial reporting with maps allows the district to easily view large amounts of incident data to understand the map or dashboard. Hotspot Maps enable quick identification of high-frequency locations.
The Incident Report dashboard provides year-over-year, direction, and response comparisons. This report will help RTMC track TSM&O goals and progress.
KEY TECHNOLOGY
Esri ArcGIS Online
Esri Feature Services
Esri Dashboards
Esri Story Maps
Python and ArcPy
511 Data Feed with Waze Events
KEY RESULTS
The Waze Alert Dashboard increased identification of events such as a car on shoulder, accident, or traffic slowdown by one-third.
Esri ArcGIS Online allows the agency to create new dashboards and maps when needed with little effort.
Using a Story Map to store all contacts in one location reduced confusion and helped streamline workflows.